PAPER:
The analysis of real data
using a multiscale stochastic volatility model*
Lorella Fatone, Francesca Mariani, Maria Cristina Recchioni, Francesco Zirilli
- Abstract
- The multiscale stochastic volatility model, the filtering and
calibration problems
- Calibration problem and forecasting experiments using real data
(movies)
- References
Warning: If your browser does not allow you to see the content of this website click here to download a word file that reproduces the material contained here.
We use filtering and maximum likelihood methods to solve a calibration problem for a multiscale stochastic volatility model. The multiscale
stochastic volatility model considered has been introduced in [4],
[5] and describes the dynamics of the asset price using
as auxiliary variables two stochastic variances varying on two different time
scales. Our aim is to estimate the
parameters of this multiscale model
(including the risk premium parameters when necessary) and its two initial
stochastic variances from the knowledge, at discrete times, of the asset
price and, eventually, of the prices of
call and/or put European options on the asset. This problem is translated in a
maximum likelihood problem with the likelihood function defined through the
solution of a filtering problem. The estimated values of the parameters and of
the two initial stochastic variances are characterized as being a constrained maximizer
of a likelihood function. Furthermore we
develop a tracking procedure that is
able to track the asset price and the values of its two stochastic
variances for time values where there are no data
available. The solution of the calibration problem and the tracking procedure
are used to do the analysis of data time
series. Numerical examples of the
solution of the calibration problem and of the performance of the tracking
procedure using synthetic and real data
are presented in [3].
The synthetic data time series is
analyzed using data samples made of observations done with a given time frequency.
We consider observation frequencies ranging from “high” to “low” and we study the performance of the calibration
procedure as a function of the observation frequency. The real data studied are
two time series of electric power price data taken from the
Acknowledgments:
· It is a pleasure
to thank V. Kholodnyi and R. Whaley of Platts Analytics Inc. (
· The numerical
experience and data analysis reported in this website have been obtained using the
computing resources of CASPUR (
· The research reported in this website is partially supported by
MUR – Ministero Università e Ricerca (
Keywords. Multiscale
stochastic volatility models, filtering problem, calibration model, option
pricing.
AMS (MOS) Subject
Classification. 62F10, 35R30, 91B70.
M.S.C. classification. 34M50, 60H10, 91B28.
J.E.L. classification. C53, G12, C61.
2. The multiscale stochastic volatility model, the filtering and
calibration problems
For the convenience of the
reader we summarize some results contained in [5]. Let R
and R+ be the sets of real and of positive real numbers respectively
and t be a real variable that denotes time. Let St, t ≥0, be a
stochastic process describing the asset (stock, commodity, index) price at time
t≥0 and xt = log(St/S0), t ≥ 0, be
the corresponding log-return. We associate to the asset price two stochastic
variances described by the stochastic processes v1,t, v2,t,
t ≥ 0, one fluctuating on a fast time scale and the other fluctuating on
a long time scale. The dynamics of the stochastic process xt, v1,t,
v2,t, t > 0, is defined by
the following system of stochastic differential equations:

where the quantities ![]() ,
, ![]() ai, bi,
i = 1,2, are real constants satisfying the following conditions: ci ³ 0, ei ³ 0, qi ³ 0, bi
≥ 0, i = 1,2. These conditions are due to the financial meaning of
the constants.
ai, bi,
i = 1,2, are real constants satisfying the following conditions: ci ³ 0, ei ³ 0, qi ³ 0, bi
≥ 0, i = 1,2. These conditions are due to the financial meaning of
the constants.
The state variables
v1,t, v2,t , t>0, are the stochastic
variances associated to xt, t>0,
Wt0,1, Wt0,2 ,Wt1,
Wt2, t>0, are standard Wiener processes such that W00,1=
W00,2=W01=W02=0, dWt0,1, dWt0,2
,dWt1, dWt2 are their stochastic
differentials and we assume that <dWt0,1dWt0,2
>= 0, <dWt0,1dWt1
>= r0,1dt, <dWt0,2dWt2
>= r0,2dt, <dWt1dWt2>=0 , where < × > denotes the mean
of × and r0,1, r0,2Î[-1,1] are constants
known as correlation coefficients.
The fact that the model is a two scale stochastic volatility model is
translated in the assumption that ![]() . The equations (1), (2), (3)
must be equipped with an initial condition, that is:
. The equations (1), (2), (3)
must be equipped with an initial condition, that is:

The random variables ![]() ,
, ![]() ,
, ![]() are assumed to be
concentrated in a point with probability one and we choose
are assumed to be
concentrated in a point with probability one and we choose ![]() =0. We assume that
=0. We assume that ![]()
![]() ,
, ![]() >0, i=1,2 and later in the multiscale model we will choose
ai=-1/2, bi=1, i=1,2.
>0, i=1,2 and later in the multiscale model we will choose
ai=-1/2, bi=1, i=1,2.
The model (1), (2), (3) generalizes the Heston stochastic volatility
model. In fact choosing a1 = -1/2, a2 = 0, b1
= 1, b2 = 0 the equations (1), (2) reduce to the Heston model and
they become decoupled from equation (3). Remind that the stochastic variances and in particular the initial
stochastic variances appearing in (5), (6) cannot be observed in real markets.
As already mentioned in all the numerical experiments
presented here we use the multiscale model model and we choose
in equations (1), (2), (3) a1
= a2 = -1/2 and b1 = b2 =
1. This choice translates in the
multiscale model the usual relation between asset price, asset log-return and
stochastic variance known from the Heston model. Remember that when the option
prices are used as data of the calibration problem the discount rate r , that
appears in the option price formulae, becomes a parameter that must be
determined in the calibration, and in that case we will choose ![]() in the option price formulae. More general problems where r
is not necessarily equal to
in the option price formulae. More general problems where r
is not necessarily equal to ![]() and ai, bi, i = 1,2, are
parameters to be determined in the calibration can be studied. We will not
consider them here.
and ai, bi, i = 1,2, are
parameters to be determined in the calibration can be studied. We will not
consider them here.
Let us introduce the vector Q =(e1,q1,r0,1,c1,![]() ,
, ![]() ,l1,e2,q2,r0,2,c2,
,l1,e2,q2,r0,2,c2, ![]() ,l2) Î R13 where the parameters
,l2) Î R13 where the parameters ![]() , i=1,2, are the risk premium parameters that must be used
when we consider option prices. The set M Ì R13 of the feasible vectors is defined as follows:
, i=1,2, are the risk premium parameters that must be used
when we consider option prices. The set M Ì R13 of the feasible vectors is defined as follows:

The constraints that define M translate some elementary properties required to model (1), (2),
(3). Moreover, let ti, i =
0,1,¼,n, be time values
such that ti
< ti+1,
i = 0,1,¼,n-1, without loss
of generality we choose t0 = 0, and for later convenience we define
tn+1 = +¥. Let ![]() be respectively the
log-return of the asset price St and the prices of European vanilla
call and put options on the asset having maturity time Ti (Ti > ti) and strike
price Ki, observed at time t = ti, i = 0,1,¼,n. We suppose that the option
prices observations
be respectively the
log-return of the asset price St and the prices of European vanilla
call and put options on the asset having maturity time Ti (Ti > ti) and strike
price Ki, observed at time t = ti, i = 0,1,¼,n. We suppose that the option
prices observations ![]() ,
, ![]() are affected by a Gaussian error with mean
zero and known variance fi, i = 0,1,¼,n, and that the asset log-returns
are affected by a Gaussian error with mean
zero and known variance fi, i = 0,1,¼,n, and that the asset log-returns ![]() , i = 0,1,¼,n, are observed without error. The filtering problem that we consider
is the following:
, i = 0,1,¼,n, are observed without error. The filtering problem that we consider
is the following:
Given the vector Q Î M find
the probability density function p(x,v1,v2,t|Ft,
Q), (x,v1,v2)
Î R×R+×R+,
t
> 0, of the random variables xt, v1,t
and v2,t, t > 0, solution of (1), (2), (3), (4), (5), (6),
conditioned to the observations Ft = {![]() : ti £ t, i > 0}, t > 0, and
forecast the values of the state variables xt, v1,t, v2,t
for t
> 0 and in particular for t ¹ ti,
i = 0,1,¼,n and for t > tn.
: ti £ t, i > 0}, t > 0, and
forecast the values of the state variables xt, v1,t, v2,t
for t
> 0 and in particular for t ¹ ti,
i = 0,1,¼,n and for t > tn.
For t = t0 = 0 we define ![]() = {
= {![]() = 0 }. Note that in
the filtering problem stated above we do not make use of the option prices
= 0 }. Note that in
the filtering problem stated above we do not make use of the option prices ![]() ,
, ![]() observed at time t = t0. That is in
the filtering problem at time t = t0 = 0, we use as datum only x0
=
observed at time t = t0. That is in
the filtering problem at time t = t0 = 0, we use as datum only x0
=![]() =
= ![]() ,
, ![]() at time t = t0
= 0 will be used as data in the calibration problem. Many other filtering
problems different from the one stated above that use as data different
combinations of asset prices and/or option prices can be studied with simple
extensions of the formulae that follows. We will not consider them here.
at time t = t0
= 0 will be used as data in the calibration problem. Many other filtering
problems different from the one stated above that use as data different
combinations of asset prices and/or option prices can be studied with simple
extensions of the formulae that follows. We will not consider them here.
Let us
define the following functions:
|
|
to be the joint probability
density functions of the random variables xt, v1,t, v2,t,
solution (1), (2), (3), (4), (5), (6), when ti < t < ti+1 conditioned to
the observations ![]() made up to time
t = ti, i = 0,1,¼,n. The functions pi(x,v1,v2,t| Q), (x,v1,v2) Î R×R+×R+,
ti < t < ti+1, i = 0,1,¼,n can be computed as
solutions of a set of initial value problems for the Fokker Planck equation (see
[5] and the reference therein) with suitable initial
conditions that involve the knowledge of the option prices.
made up to time
t = ti, i = 0,1,¼,n. The functions pi(x,v1,v2,t| Q), (x,v1,v2) Î R×R+×R+,
ti < t < ti+1, i = 0,1,¼,n can be computed as
solutions of a set of initial value problems for the Fokker Planck equation (see
[5] and the reference therein) with suitable initial
conditions that involve the knowledge of the option prices.
Using the functions pi(x,v1,v2,t| Q), (x,v1,v2) Î R×R+×R+,
ti < t < ti+1, i = 0,1,¼, n, we can forecast the
values of the state variables of the model xt, v1,t, v2,t,
t > 0, respectively as
the expected values![]() ,
, ![]() ,
, ![]() , t
> 0,
conditioned to the observations contained in Ft, t > 0, of the random variables xt,
v1,t, v2,t, t > 0, that is:
, t
> 0,
conditioned to the observations contained in Ft, t > 0, of the random variables xt,
v1,t, v2,t, t > 0, that is:

![]()
where E(· | +) denotes the expected
value of · conditioned to + and the functions fi(v1,v2;Q) are defined
through the knowledge of the conditioned probability densities (8) (see [3] for further details) and are given as two-dimensional
integrals of explicitly known integrands. The formulae (9), (10) can be used to track
the random variables xt, v1,t, v2,t, for t > 0, and in particular for t ¹ ti, i = 0,1,¼,n and for t > tn and they
constitute the tracking procedure announced in the Abstract.
We note that the model (1), (2), (3) together with the associated
option price formulae are parameterized by 13 real quantities, that is: the
model parameters ![]() , ci, qi, ei, i = 1,2, the risk
premium parameters li, i = 1,2, the
correlation coefficients r0,i, i = 1,2, and the
initial stochastic variances
, ci, qi, ei, i = 1,2, the risk
premium parameters li, i = 1,2, the
correlation coefficients r0,i, i = 1,2, and the
initial stochastic variances ![]() , i = 1,2. That is, when we consider the calibration problem using as data asset and
option prices we use the vector Q =(e1,q1,r0,1,c1,
, i = 1,2. That is, when we consider the calibration problem using as data asset and
option prices we use the vector Q =(e1,q1,r0,1,c1,![]() ,
, ![]() ,l1,e2,q2,r0,2,c2,
,l1,e2,q2,r0,2,c2, ![]() ,l2) Î R13 and the set M Ì R13 defined in
(10).
,l2) Î R13 and the set M Ì R13 defined in
(10).
The vector Q Î R13 is the unknown of the calibration problem considered
here when we use as data asset and option prices and the set M defines
the set of the “feasible” vectors, that is the set of vectors satisfying the
constraints. Later in the formulation of the calibration problem we will assume
Q Î M. When we consider the filtering and calibration problems using as
data only asset prices the risk premium parameters li, i = 1,2, that
appear in the option price formulae, must be removed from the vector Q and the definition of the
vector Q and of the set M
must be changed consequently. To fix the ideas we discuss in detail only the situation where
asset prices and option prices are used as data in the filtering and in the
calibration problem. We leave to the reader to work out the obvious changes
that are needed when simpler problems are considered.
The calibration problem consists in
determining the value of the vector Q Î M that makes most likely the observations ![]() , made at time t = ti, i = 0,1,¼,n. In the calibration problem
we add to the data of the filtering problem the call and put option prices at
time t = t0 and this fact improves greatly the quality of the
estimates of the initial stochastic variances resulting from the solution of
the calibration problem. The improvement of the quality of the estimated
initial stochastic variances determines an improvement in the estimates of all
the remaining parameters contained in the vector Q.
, made at time t = ti, i = 0,1,¼,n. In the calibration problem
we add to the data of the filtering problem the call and put option prices at
time t = t0 and this fact improves greatly the quality of the
estimates of the initial stochastic variances resulting from the solution of
the calibration problem. The improvement of the quality of the estimated
initial stochastic variances determines an improvement in the estimates of all
the remaining parameters contained in the vector Q.
As suggested in [6], [10] given the observations ![]() at time t = ti,
i = 0,1,¼,n, we measure the (log-)likelihood of a vector Q Î M through the following
(log-) likelihood function:
at time t = ti,
i = 0,1,¼,n, we measure the (log-)likelihood of a vector Q Î M through the following
(log-) likelihood function:

where we
have defined:

and pi(x,v1,v2,ti-| Q) = ![]() pi(x,v1,v2,t| Q),
pi(x,v1,v2,t| Q), ![]() means left limit for t that goes to ti,
i = 1,2,¼,n and C and P are
the formulae derived in [5] for the price of European
vanilla call and put options in the multiscale model (1), (2), (3) respectively
. The calibration problem that we
consider is the following one:
means left limit for t that goes to ti,
i = 1,2,¼,n and C and P are
the formulae derived in [5] for the price of European
vanilla call and put options in the multiscale model (1), (2), (3) respectively
. The calibration problem that we
consider is the following one:
Given the observations ![]() at time t = ti,
i = 0,1,¼,n, determine the vector Q* Î M Ì R13
solution of the following nonlinear constrained optimization problem:
at time t = ti,
i = 0,1,¼,n, determine the vector Q* Î M Ì R13
solution of the following nonlinear constrained optimization problem:
|
(13) |
Problem (23) is known as maximum (log-)likelihood problem since the
vector Q* Î M solution of (13) is the vector that makes “more likely” the
observations actually made. The vector Q* Î M is the solution of the calibration problem. Note that problem (13)
is only one possible way of using the maximum likelihood method to formulate
the calibration problem that we are considering. Many other formulations of the
calibration problem are possible and legitimate.
3 Calibration problem and forecasting experiments using real data
In this section we show two
experiments that use real data. In these two experiments daily data are used.
The first experiment consists in the analysis of two time series of electric
power price data, the first time series does not contain spikes while the
second one contains spikes. No option prices are used as data in this
experiment. The electric power price data studied are taken from the
The first numerical experiment considers two time
series of electric power price data. The first time series consists of 365
daily price observations ![]() i = 0,1,¼,364, that is it is a year,
made of 365 days, of daily observations. The second time series consists of 765
daily price observations
i = 0,1,¼,364, that is it is a year,
made of 365 days, of daily observations. The second time series consists of 765
daily price observations ![]() , i = 0,1,¼764. In this experiment no
option price data are used. Figure 1 shows the daily log-return increment
, i = 0,1,¼764. In this experiment no
option price data are used. Figure 1 shows the daily log-return increment ![]() =
=![]() , i = 1,2,¼,364, of the
electric power price data
, i = 1,2,¼,364, of the
electric power price data ![]() , i = 0,1,¼,364. The time
series shown in Figure 1 does not contain spikes. Figures 2 and 3 show the
daily log-return increment of the second time series of electric power price
data that is
, i = 0,1,¼,364. The time
series shown in Figure 1 does not contain spikes. Figures 2 and 3 show the
daily log-return increment of the second time series of electric power price
data that is ![]() =
=![]() , i=1,2,…,764. Figure 2 shows the daily log-return increment of the
second time series of electric power price data in the first year of
observation and Figure 3 shows the daily log-return increment in the second
year of observation. The time series shown in Figures 2 and 3 contains spikes.
, i=1,2,…,764. Figure 2 shows the daily log-return increment of the
second time series of electric power price data in the first year of
observation and Figure 3 shows the daily log-return increment in the second
year of observation. The time series shown in Figures 2 and 3 contains spikes.
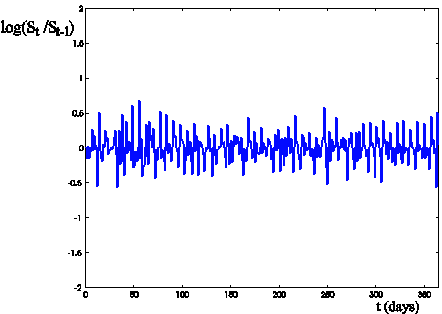
Figure 1: Log-return increment log(St/St-1)
of the electric power prices versus time t (days) (time series with no spikes ![]() , i=0,1,…,364,
daily data).
, i=0,1,…,364,
daily data).
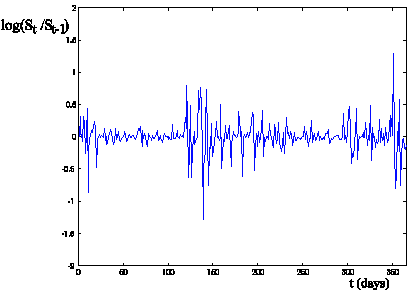
Figure 2: Log-return increment log(St/St-1)
of the electric power prices versus time t (days) (time series with spikes ![]() , i=0,1,2,…,364, first year of observation, daily data).
, i=0,1,2,…,364, first year of observation, daily data).
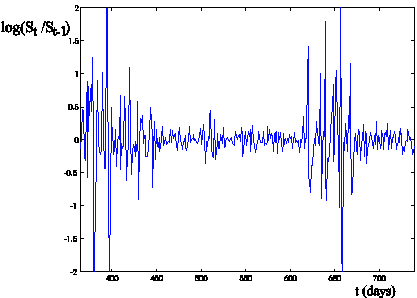
Figure 3: Log-return increment log(St/St-1)
of the electric power prices versus time t (days) (time series with spikes ![]() ,
i=365,366,…,764, second year of observation, daily data).
,
i=365,366,…,764, second year of observation, daily data).
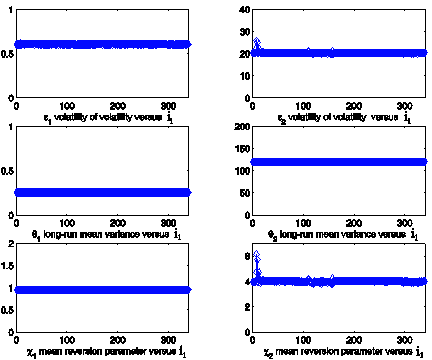
Figure 4: Estimated parameter values obtained
solving 340 calibration problems using as data a data window of the electric power prices
(time series with no spikes, Figure 1) versus the calibration problem number i1.
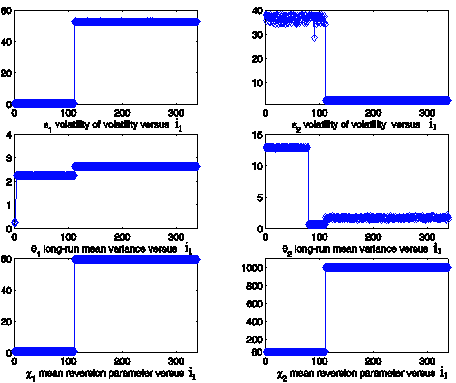
Figure 5: Estimated parameter values obtained
solving 340 calibration problems using as data a data window of the electric
power prices (time series with spikes, Figure 2) versus the calibration problem
number i1.
Figure 6: Estimated parameter values obtained
solving 740 calibration problems using as data a data window of the electric
power prices (time series with spikes, Figures 2, 3) versus the calibration
problem number i1.
We begin the analysis of these time series calibrating
the multiscale model using a data window
made of 26 consecutive daily observations and we move this window along the
time series substituting the first observation of the window with the next
observation after the window. Using this procedure in the case of the time
series shown in Figure 1 we solve 340 (340=365-26+1) calibration problems
numbered with the index i1, i1 = 1,2,¼,340 and in the case of the
time series shown in Figures 2 and 3 we solve 740(740=765-26+1) calibration
problems numbered with the index i1, i1 = 1,2,¼, 740. The index i1
is the value of the index i associated to the first day contained in the data
window used in the calibration. Figures 4 and 5 show the results obtained
solving the calibration problems associated to the two time series of data as a
function of the index i1 for i1 = 1,2,¼,340. Figure 4 shows the
results obtained processing the time series of electric power price data with
no spikes (shown in Figure 1). Remind that this time series is made of one year
of daily data. Figure 5 shows the results obtained processing the first year of
the time series of electric power price data with spikes (shown in Figure 2).
We focus our attention on Figures 4, 5 to point out the different behaviour of
the estimated parameter values in the two cases. In absence of spikes (Figure 4)
the parameters ei, qi, ci, i = 1,2, are
stable, that is they are approximately constants as a function of i1,
and c1 and c2 are of the same
order of magnitude (i.e.: c1 » 1, c2 » 4). In presence of spikes
(Figure 5) the parameters ei, qi, ci, i = 1,2, have a
jump in correspondence of the first spike. However comparing Figure 2 and
Figure 5 we can see that the calibration procedure produces two values of the
ratio c1/c2, in particular
after the spike (i.e. i1 > 100) Figure 5 shows a jump in the ratio c1/c2 and we have c1 << c2.
Figure 6 shows the estimated values of the parameters ei, qi, ci, i = 1,2, during
the entire observation period covered by the data shown in Figures 2 and 3
(time series with spikes). We note the presence of a jump in the estimated
parameter values around i1 = 395. Note that when we solve the
calibration problem corresponding to i1 = 395 we use as data the 26
consecutive daily observations starting with the 395th observation
day. That is, this calibration problem takes as input data one of the spikes
(see Figure 3) contained in the time series. The fact that Figures 4, 5, 6 show
that the model parameters as a function of the index i1 are
approximately piecewise constant functions suggests that the model and the
calibration procedure proposed are well suited to establish a stable
relationship between the data and the unknown of the calibration problem.
Moreover using formulae (9), (10), that is using the
tracking procedure, we forecast the
electric power prices using as data of the calibration problems the data
corresponding to the time series containing the spikes (shown in Figures 2, 3).
That is we take a data window of 26 consecutive days in the time series of
electric power price data we solve the corresponding calibration problem, we
use the (approximate) solution of the calibration problem Q = Q* and formulae (9),
(10) to forecast the values of the state variables in the future. The future
consists in the time period after the last day whose observation is contained
in the data window used in the calibration problem. The data window used as
input data of the calibration problem is rolled through the time series using
the procedure already described.
The results obtained in this forecasting exercise are illustrated
in Table 1, Figures 7, 8, Animation 1, Animation 2, Animation 3.
Table 1 establishes the quality of the forecasted
values of the electric power log-returns when we do forecasts up to fifteen days
in the future and we process the data corresponding to the time series shown in
Figures 2, 3. That is Table 1 contains the mean value of the relative error, ![]() , committed approximating the observed log-return with the
forecasted log-return, the column “trend” of Table 1 contains (in percent) the
number of times that the forecasted log-return moves in the correct direction
with respect to the log-return of the first day contained in the data used in
the calibration, that is increases when the historical log-return increases and
decreases when the historical log-return decreases. The last column
, committed approximating the observed log-return with the
forecasted log-return, the column “trend” of Table 1 contains (in percent) the
number of times that the forecasted log-return moves in the correct direction
with respect to the log-return of the first day contained in the data used in
the calibration, that is increases when the historical log-return increases and
decreases when the historical log-return decreases. The last column![]() of Table 1 contains
the same quantity than
of Table 1 contains
the same quantity than ![]() computed on the
log-returns observed before the first spike, that is for i1 £
computed on the
log-returns observed before the first spike, that is for i1 £
Finally Figures 7, 8 show the forecasted values of the log-return
(one day in the future) and the time series of the log-returns corresponding to
the time series shown in Figures 2, 3 as a function of time t (days). Figure 8 reproduces
on a different scale the part of Figure 7 corresponding to 300 £ t £ 500. This is the region where
severe spikes occur (see Figures 2, 3). Figures 7 and 8 show the very high
quality of the (one day in the future) forecasted log-returns in a more
convincing way than Table 1 where we consider highly aggregated performance
indices. The Animations 1, 2,
3 show respectively the quality of the forecasted log-returns one day, five
days and fifteen days in the future.
|
of days in the future |
|
trend (%) |
|
|
1 |
0.0485 |
90.53% |
0.0167 |
|
2 |
0.0786 |
82.27% |
0.0268 |
|
3 |
0.0968 |
77.54% |
0.0310 |
|
4 |
0.1078 |
73.88% |
0.0324 |
|
5 |
0.1131 |
72.94% |
0.0322 |
|
15 |
0.1773 |
63.06% |
0.0474 |
Table 1: Mean relative errors and “trend” of
the forecasted values of the electric power log-returns of the time series with
spikes when compared to the log-returns actually observed.
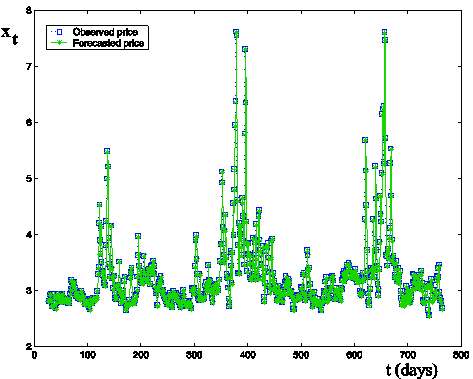
Figure 7: Forecasted values (one day in the
future) (stars) and observed values (squares) of the log-returns of electric
power prices (time series with spikes, Figures 2, 3) versus time t (days).
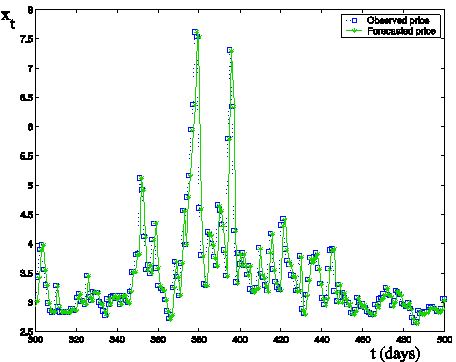
Figure 8: Forecasted values (one day in the
future) (stars) and observed values (squares) of the log-returns of electric
power prices (time series with spikes, Figures 2,3) versus time t (days).
In all the animations the square is the observed value of the log-return
and the star is the forecasted value.
Animation 1: Forecasted log-return one day in
the future (data time series with spikes Figures 2, 3) click here, reduced animation on a different
scale click here
Animation 2: Forecasted log-return five days in
the future data time series with spikes Figures 2, 3) click here, reduced animation on a different
scale click here
Animation 3: Forecasted log-return fifteen days
in the future data time series with spikes Figures 2, 3) click here, reduced animation on a
different scale click here
The second numerical experiment consists in the
analysis of the daily closing values of the S&P 500 index and of the daily
bid prices of the European call and put options on the S&P 500 index with
maturity date December 16, 2005 and strike price K = 1200 during the period of
about eleven months that goes from January 3, 2005 to November 28, 2005. Due to
the number of trading days in the year 2005 the time unit is a “year" made
of 253 days. Note that the call and the put options mentioned above whose
prices have been used as data in this experiment during the period January,
November, 2005 had a significant volume traded. To avoid excessive numerical
work we analyze in detail the market data (i.e. S&P 500 index and the
European vanilla call and put option prices on this index) only in the months
of January, February, May, June, October and November, 2005. The results
presented are representative of the results obtainable from an exhaustive
analysis of the eleven months of data available. We have solved the calibration
problem (13) using the data contained in a window made of fifteen consecutive
observation days, that is fifteen daily observations of the log-return of the
S& P 500 index and of the call and put option prices on S& P 500 index
having maturity time December 16, 2005 and strike price K =
We solve three calibration problems, the first one
uses as data the data relative to the first fifteen observation days of January
2005, the second one uses as data the data relative to the last twelve
observation days of May 2005 and the first three observation days of June 2005,
and the third one uses as data the data relative to the last twelve observation
days of October 2005 and the first three observation days of November 2005.
These three calibration problems have been chosen in order to be able to
compare the results presented here with those presented in [5].
The three sets of estimated parameter
values obtained solving these three calibration problems are used to forecast
the value of the S&P 500 and the prices of its call and put European
vanilla options one day, one week and one month in the future (that is one day,
one week, one month after the day of the last observation contained in the data
used in the calibration problem). The quality of these forecasts is established
by comparison with the corresponding historical data. Moreover a comparison of
the results obtained using the calibration procedure proposed here with the
results obtained using the least squares formulation of the calibration problem
proposed in [5] is presented.
The forecast of the S& P 500 index is done with
the tracking procedure derived from (9), (10) already discussed. The forecast
of the option prices is done using formulae derived in [5] and
recalled in [3] starting from the model parameters,
including the correlation coefficients, the risk premium parameters and the
initial stochastic variances, estimated solving the calibration problem. We use
option formulae with two different
choices of asset price, that is: the price actually observed in the day of the
forecast or the asset price forecasted using formula (10). The first choice is
considered in order to compare the results obtained in [3] and in this website
with those presented in [5] where the asset price actually observed the
day of the forecast was used. We note that in the option price formulae we use
always the values of the stochastic variances obtained using formula (10). That
is, given the stochastic variances v1,t, v2,t, at time t
= t0 = ![]() where
where ![]() is the time of the first observation used in
the calibration problem (that is given the initial stochastic variances
is the time of the first observation used in
the calibration problem (that is given the initial stochastic variances ![]() , i = 1,2 that are estimated solving the calibration problem)
we forecast v1,t, v2,t, t > t0, using formula (10) where the vector Q is chosen to be the vector Q* obtained as
solution of the calibration problem. Starting from the solution of the first
calibration problem (data corresponding to the first fifteen observation days
of January 2005) we forecast the index value and the option prices (in some
specified days of January and February 2005). In Table 2 we show the relative
errors made in the forecast of the S&P 500 index value eindex
and of the bid prices of the European vanilla call option, ecall option,
and put option, eput option, having strike price K = 1200 and
maturity time T given by December 16, 2005 obtained forecasting up to a month
in the future. In Table 2 the option prices are forecasted using as asset price
the forecasted values of the S&P 500 index in the days of the forecasts.
The errors are computed comparing the forecasted values with the historical
data. The results shown in Table 2 relative to some specified days of January
and February, 2005 are somehow representative of the results obtained with a
more exhaustive analysis of the data available. Note that the forecasted values
of the S&P 500 index are really satisfactory and of much higher quality
than the forecasted values of the electric power prices (compare Table 1 and
Table 2). This difference is due to two facts: the first one is the use of the
option prices in the calibration procedure when we study the S& P 500 data.
The option prices improve the quality of the solution of the calibration
problem and of the conditioned probability densities. No option prices are used
in the solution of the calibration problem for the electric power price data.
The second one is the huge historical volatility of the time series of the
electric power price data in comparison with the historical volatility of the
S&P 500 index in 2005. This last fact makes the forecasting problem for the
electric power price data substantially more difficult than the corresponding
problem for the S&P 500 index in 2005.
, i = 1,2 that are estimated solving the calibration problem)
we forecast v1,t, v2,t, t > t0, using formula (10) where the vector Q is chosen to be the vector Q* obtained as
solution of the calibration problem. Starting from the solution of the first
calibration problem (data corresponding to the first fifteen observation days
of January 2005) we forecast the index value and the option prices (in some
specified days of January and February 2005). In Table 2 we show the relative
errors made in the forecast of the S&P 500 index value eindex
and of the bid prices of the European vanilla call option, ecall option,
and put option, eput option, having strike price K = 1200 and
maturity time T given by December 16, 2005 obtained forecasting up to a month
in the future. In Table 2 the option prices are forecasted using as asset price
the forecasted values of the S&P 500 index in the days of the forecasts.
The errors are computed comparing the forecasted values with the historical
data. The results shown in Table 2 relative to some specified days of January
and February, 2005 are somehow representative of the results obtained with a
more exhaustive analysis of the data available. Note that the forecasted values
of the S&P 500 index are really satisfactory and of much higher quality
than the forecasted values of the electric power prices (compare Table 1 and
Table 2). This difference is due to two facts: the first one is the use of the
option prices in the calibration procedure when we study the S& P 500 data.
The option prices improve the quality of the solution of the calibration
problem and of the conditioned probability densities. No option prices are used
in the solution of the calibration problem for the electric power price data.
The second one is the huge historical volatility of the time series of the
electric power price data in comparison with the historical volatility of the
S&P 500 index in 2005. This last fact makes the forecasting problem for the
electric power price data substantially more difficult than the corresponding
problem for the S&P 500 index in 2005.
|
of days
in the
future |
eindex |
ecall option |
eput option |
|
1 |
7.522·10-5 |
0.0659 |
0.0407 |
|
2 |
1.303·10-4 |
0.0559 |
0.0737 |
|
3 |
1.7509·10-4 |
0.0893 |
0.0952 |
|
4 |
2.6962·10-4 |
0.0528 |
0.0793 |
|
5 |
2.9114·10-4 |
0.0496 |
0.0822 |
|
15 |
3.7106·10-4 |
0.0268 |
0.1810 |
|
30 |
3.5094·10-4 |
0.0717 |
0.1099 |
Table 2:
Relative errors of the forecasted values of the SP&500 and of the
corresponding call and put option prices in some specified days of January and February 2005 when compared to the
prices actually observed. The model parameters employed have been obtained
solving the calibration problem using as data the data relative to the first
fifteen observation days of January 2005.
Finally we use the estimated model parameter vectors
obtained as solution of the calibration problems to forecast the prices of all
the European call options on the S&P 500 index traded in a given day. The
days that we consider are January 28, 2005, June 7 and 28, 2005 and November 7,
14 and 28, 2005. Note that in the year 2005 we had approximately three hundreds
European call options on the S&P 500 index traded. The forecast of the
option prices of January 28, 2005 is done using the vector Q obtained solving the
calibration problem using as data the first fifteen observation days of January
2005. The forecast of the option prices of June 7 and 28, 2005 and November 7,
14 and 28, 2005 are done using as data the first three observation days of the
current month (June and November respectively) and the last twelve observation
days of the previous month (May and October respectively). We consider the days
January 28, June 7 and 28, November 7, 14 and 28, 2005 because we have at our
disposal the results presented in [5] relative to the
forecasts of the call option prices of these days made using the model parameter vectors
obtained as solution of the calibration problem formulated with the least
squares procedure discussed in [5]. We compare the call
option prices obtained solving the calibration problem with the maximum
likelihood procedure presented in this paper with those obtained solving the
calibration problem with the least squares procedure introduced in [5]. Let us introduce some notation necessary to illustrate
the comparison. Let nobs be the number of call option prices
available at time ![]() and let
and let ![]() ,
, ![]() and
and ![]() denote respectively
the (observed) prices at time
denote respectively
the (observed) prices at time ![]() of European call options with strike price Ki
and maturity time Ti, the prices generated using the appropriate
formula (see [3], [5]) with the
parameter vector obtained solving the calibration problem with the least
squares procedure (LS) and with the parameter vector obtained solving the
calibration problem using the maximum likelihood procedure (ML). The index i
spans all the European call options traded at time
of European call options with strike price Ki
and maturity time Ti, the prices generated using the appropriate
formula (see [3], [5]) with the
parameter vector obtained solving the calibration problem with the least
squares procedure (LS) and with the parameter vector obtained solving the
calibration problem using the maximum likelihood procedure (ML). The index i
spans all the European call options traded at time ![]() . Note that nobs may depend on
. Note that nobs may depend on ![]() , we omit this dependence for simplicity. Let us define the absolute error:
, we omit this dependence for simplicity. Let us define the absolute error:

obtained using the two
calibration procedures (A = LS (least squares procedure), ML (maximum
likelihood procedure)), in [3] we consider ![]() as a function of the
moneyness K/S0 = Ki/S0, i = 1,2,¼,nobs, where S0
=
as a function of the
moneyness K/S0 = Ki/S0, i = 1,2,¼,nobs, where S0
=![]() is the value of the
S&P 500 index at the transaction day
is the value of the
S&P 500 index at the transaction day ![]() where the option prices are forecasted and as
a function of the time to maturity ti = Ti-
where the option prices are forecasted and as
a function of the time to maturity ti = Ti-![]() , i = 1,2,¼, nobs. Note that the
sets of the values assumed by the moneyness and by the time to maturity may
contain repeated values. In Table 3 we show the mean absolute error:
, i = 1,2,¼, nobs. Note that the
sets of the values assumed by the moneyness and by the time to maturity may
contain repeated values. In Table 3 we show the mean absolute error:

|
Date t |
etmean, ML |
etmean,LS |
|
January 28, 2005 |
4.69 ·10-3 |
2.84·10-3 |
|
June 7, 2005 |
5.99 ·10-3 |
1.75·10-3 |
|
June 28, 2005 |
6.87 ·10-3 |
2.56·10-3 |
|
November 7, 2005 |
3.68·10-3 |
3.04·10-3 |
|
November 14, 2005 |
3.07·10-3 |
2.21·10-3 |
|
November 28, 2005 |
3.21·10-3 |
2.41·10-3 |
Table 3: Quality of the
forecasted values of the option prices established comparing the forecasted
prices with the prices actually observed when the maximum likelihood (ML) or
the least squares (LS) method are used in the calibration of the multiscale
model.
Note that the absolute errors shown in Table 3 are referred to quantities roughly
speaking of order 0.1.
We
conclude this Section making some comments on the results obtained doing the
forecasts with the least squares (LS) or with the maximum likelihood (ML)
procedures.
We recall that in [5] we have
solved three calibration problems using the least squares formulation and the
call option price data of January 3, 2005, June 3, 2005 and November 3, 2005.
Note that the least squares procedure to solve the calibration problem of
January 3, 2005 uses nobs = 281 call option prices. Similarly the
calibration problem of June 3, 2005 uses nobs = 281 call option
prices and the calibration problem of November 3, 2005 uses the prices of nobs
= 303 call options prices. We use the parameter estimated using the call option
prices of January 3, 2005 (nobs = 281) to forecast the option prices
of January 28, 2005 (nobs =
258) and similarly we use the parameters estimated using the call option prices
of June 3, 2005 (nobs = 281) to forecast the option prices of June 7,
2005 (nobs= 288) and June 28,
2005 (nobs = 278) and the parameters estimated using the call option
prices of November 3, 2005 (nobs = 303) to forecast the option
prices of November 7, 2005 (nobs = 303), November 14, 2005 (nobs
= 305) and November 28, 2005 (nobs = 292).
We proceed similarly with the parameter values
estimated solving the three calibration problems mentioned above with the maximum likelihood procedure. In fact
we use the parameters estimated using the first fifteen daily observations of
January 2005 of the S& P 500 index and of the prices of the European call
and put options with K = 1200 and T given by December 16, 2005 to forecast the
prices of all the call options traded on January 28, 2005. That is we forecast
the prices of January 28, 2005 of nobs = 258 call options. Moreover
we use the parameters estimated using the last twelve observation days of May
2005 and the first three observation days of June 2005 of the S& P 500
index and of the prices of the European call and put options with K = 1200 and
T given by December 16, 2005 to forecast the prices of all the call options
traded on June 7 and June 28, 2005. That
is we forecast the prices of June 7of nobs= 288 call options and the
prices of June 28, 2005 of nobs
= 278 call options. Finally, we use the parameters estimated using the last
twelve observation days of October 2005 and the first three observation days of
November 2005 of the S& P 500 index and of the price of the European call
and put options with K = 1200 and T given by December 16, 2005 to forecast the
prices of all the call options traded on November 7, 14, 28, 2005. That is we
forecast the prices of November 7, 2005 of nobs = 303 call options,
the prices of November 14, 2005 of nobs = 305 call options and the
prices of November 28, 2005 of nobs = 292 call options.
Table 3 shows the results obtained. Remind that in the forecasts considered in
Table 3 we use as value of the S&P 500 index the actual value of the index
the day of the forecast and not its forecasted value. The results presented in
Table 3 show that the option prices forecasted with the two methods are
approximately of the same quality. We can conclude that the maximum likelihood
approach to the calibration problem has two advantages when compared to the
least squares approach presented in [5]. The first one
is that a relatively small number of data is used to calibrate the model. In
fact only one European call and one European put option prices and the
corresponding value of the index are considered for each day of data and a time
window of fifteen consecutive trading days is used as input data in the
calibration problem. This corresponds to forty-five data. The least squares procedure
uses as data all the call options traded in a given day that is approximately
three hundred data. The second one is the fact that the maximum likelihood
approach thank to the tracking procedure discussed previously allows to
forecast the value of the asset, that is the value of the S&P 500 index.
This is a consequence of the solution of the filtering problem. This makes
possible to “forecast” option prices without knowing the value of the S&P
500 index the day of the forecast. Finally we note that going back to Table 2 we can say that the parameter
values obtained using the maximum likelihood approach give satisfactory results
when used to forecast the option prices up to a month in the future.
4. References
[1] F.
Black, M. Scholes, “The pricing of
options and corporate liabilities”, Journal of Political Economy, 81, 637-659 (1973).
[2] R. Cont,
P. Tankov, Financial modelling with
jump processes, Chapman & Hall/CRC Financial Mathematics Series,
[3] L.
Fatone, F. Mariani, M.C. Recchioni, F.
Zirilli: “The analysis of real data using a multiscale stochastic volatility model”, European Financial Management, 19(1), 153-179 (2013) .
[4] L. Fatone,
F. Mariani, M.C. Recchioni, F. Zirilli: “Calibration of a multiscale
stochastic volatility model using as data European option prices”,
Mathematical Methods in Economics and Finance, 3, 49-61 (2008).
[5] L. Fatone, F. Mariani, M.C.
Recchioni, F. Zirilli: “European option
prices under an explicitly solvable multi-scale stochastic volatility model and
the analysis of the implied values of the parameters, of the correlation
coefficients and of the initial stochastic variances of the model”,
Journal of Futures Markets, 29(9), 862-893 (2009). (http://www.econ.univpm.it/recchioni/finance/w7).
[6] L. Fatone, F. Mariani, M.C. Recchioni, F.
Zirilli: “The calibration of the Heston stochastic volatility model using
filtering and maximum likelihood methods”, in Proceedings
of Dynamical Systems and Applications, G.S.Ladde, N.G.Medhin,Chuang Peng,
M.Sambandham Editors,Dynamic Publishers,Atlanta,USA, 5, 170-181 (2008) (ISBN 1-890888-01-6). (http://www.econ.univpm.it/recchioni/finance/w6).
[7] L. Fatone, F.
Mariani, M.C. Recchioni, F. Zirilli: “Maximum likelihood estimation of the
parameters of a system of stochastic differential equations that models the
returns of the index of some classes of hedge funds”, Journal of Inverse and
Ill-Posed Problems, 15, 329-362 (2007). (http://www.econ.univpm.it/recchioni/finance/w5
contains downloadable software).
[8] S.L. Heston, “A closed-form
solution for options with stochastic volatility with applications to bond and
currency options”, Review of Financial Studies, 6, 327-343 (1993).
[9] A. Lipton, Mathematical methods for foreign
exchange, World Scientific Pubblishing Co. Pte. Ltd,
[10] F. Mariani, G.
Pacelli, F. Zirilli: "Maximum likelihood estimation of the Heston
stochastic volatility model using asset and option prices: an application of nonlinear filtering
theory", Optimization Letters, 2, 177-222 (2008), (http://www.econ.univpm.it/pacelli/mariani/finance/w1 contains downloadable software).